South Road is the main street in Walkley, Sheffield. It has a history of being a vibrant local shopping street. Though there are no longer 13 grocers shops (!), there are many excellent independent shops and local services.
There is now also a lot of motor traffic. It has constant passing traffic during the day. In the evening peak it becomes a long queue of vehicles, and later on drivers speed through.
I wondered how much of the peak time traffic does pass straight through South Road (and Howard Road)? With the patient help of my friend Dexter we made two simultaneous videos, one at either end (Fulton Road, and the library). They covered a 20 minute period starting at 5:30pm on a term-time Monday in July.
I could then play the clips back side-by-side and count matching vehicles which have driven right through. It was a way to find out some things that are hard to know from a single point survey.
Speeds
I timed a handful of vehicles to get their average speed across the 700m between Fulton Road and Walkley Road at the library (including waiting at the lights, as that’s all part of the journey). It’s a 30mph limit, and there seems to be official reluctance to reduce it to 20mph.
| Type of vehicle | Median | Mean |
|---|---|---|
| Car | 8.9 mph | 10.8 mph |
| Bicycle | 10.45 mph | 10.1 mph |
| Bus | 7.1 mph (one bus) | |
Most of the bicycles were traveling faster than the cars.
Proportion driving through
Of 173 motor vehicles entering at Fulton Road, I could match 106 leaving South Road at the library (not including the bus, as we already know its route!). I make that 61%. Though I expect that some more may have stopped at Asda longer than this sample duration would capture.
Of the vehicles leaving South Road at the library, 76% had driven through from Fulton Road.
Types of transport
At Fulton Road, figures multiplied to give peak per-hour rates:
| Mode | Entering Walkley (westbound) | Leaving South Road (eastbound) |
|---|---|---|
| Car | 501 | 216 |
| Walking | 168 | 33 |
| Cycling | 54 | 3 |
| Taxi | 12 | 6 |
| Goods vehicle (medium/heavy) | 3 | 0 |
| Motorcycle | 6 | 3 |
| Bus | Not included as not possible to count passengers or get a meaningful sample in this short survey. | |
This gives a (rough estimate) peak hour traffic volume of 775 PCUs, and daily volume of perhaps around 7,500.
For reference, the Dutch guidance for traffic volumes people can cycle in comfortably without segregation is maximum of 2000 PCUs per day or 200 per peak hour – a fraction of the traffic on this road.
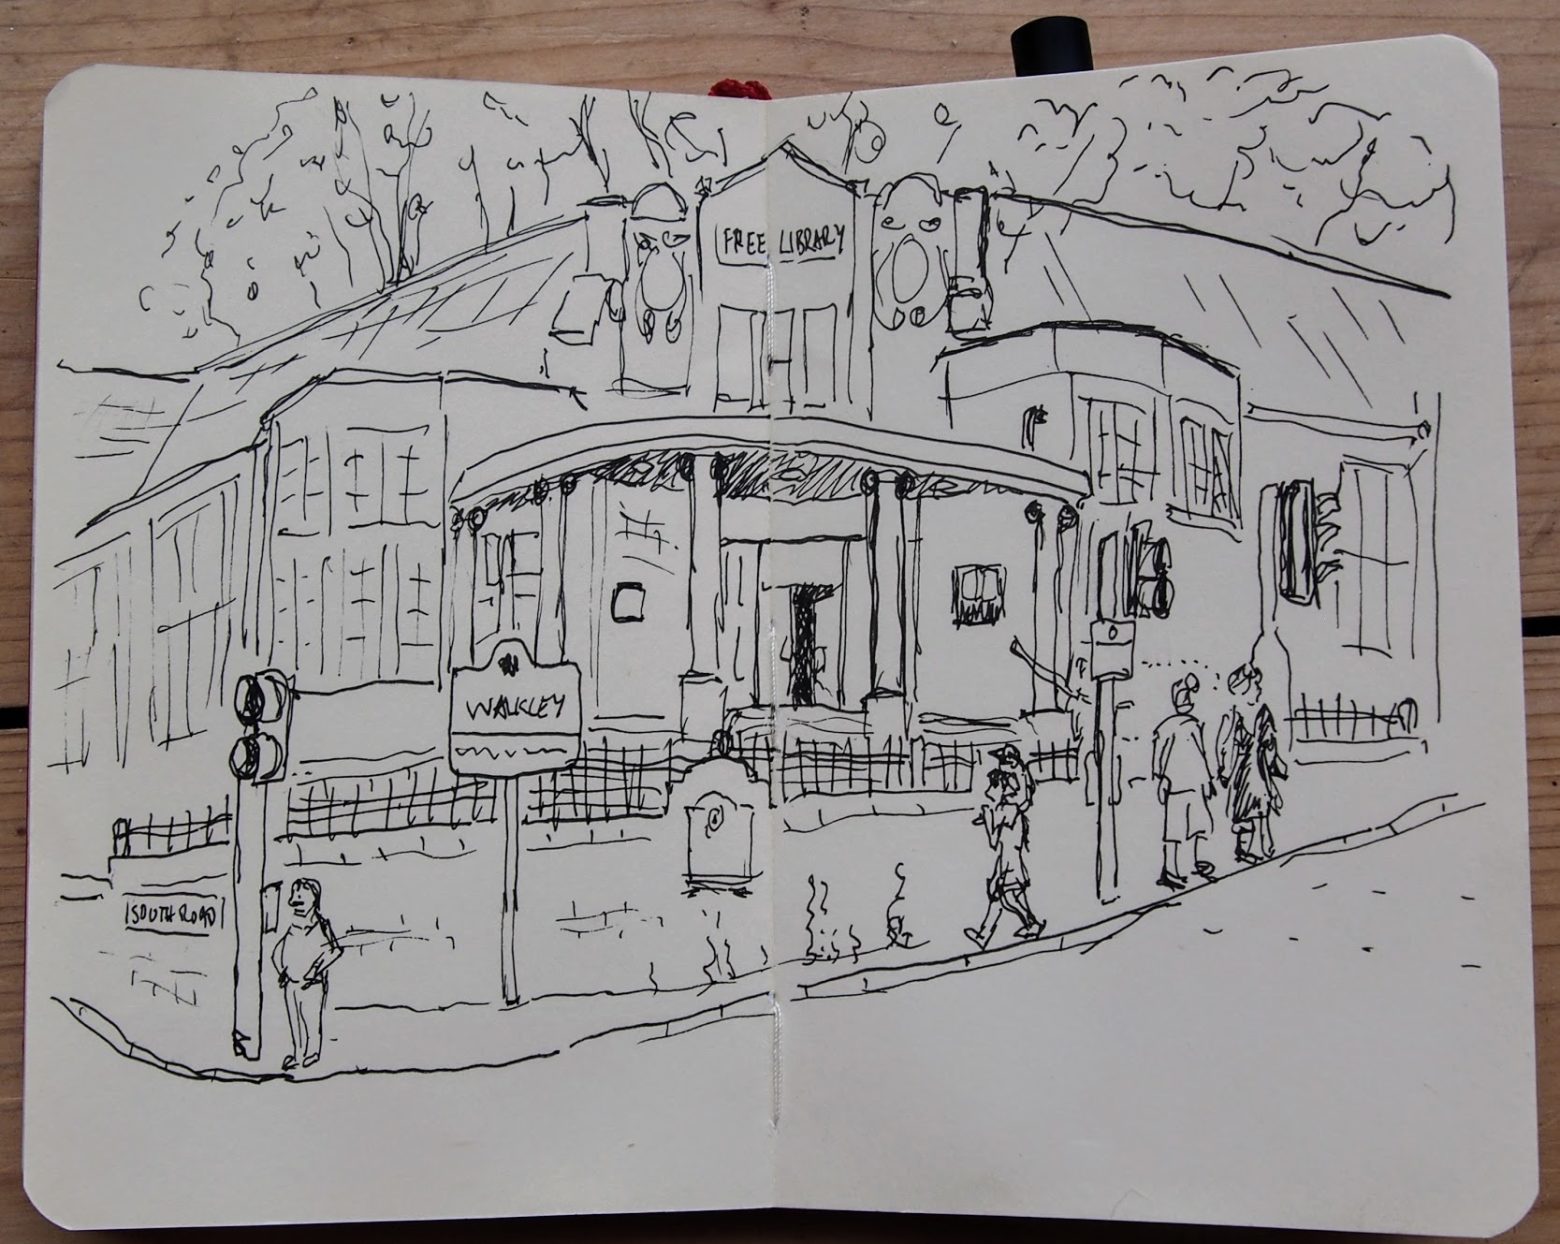
While I waited for the video to record I indulged in a bit of sketching (see top). I tried not to think too much about the fact that the air around this junction is illegally toxic, regularly breaching EU limits for nitrogen dioxide (its 2017 average measured level was 42, with the legal max set at 40).
Next
I’ll go through the library junction video again and get a traffic count for up/down Walkley Road. And which way drivers turn out of South Road.